How to visualize and ABC transporter's substrate cavity waters using VMD
Table of Contents
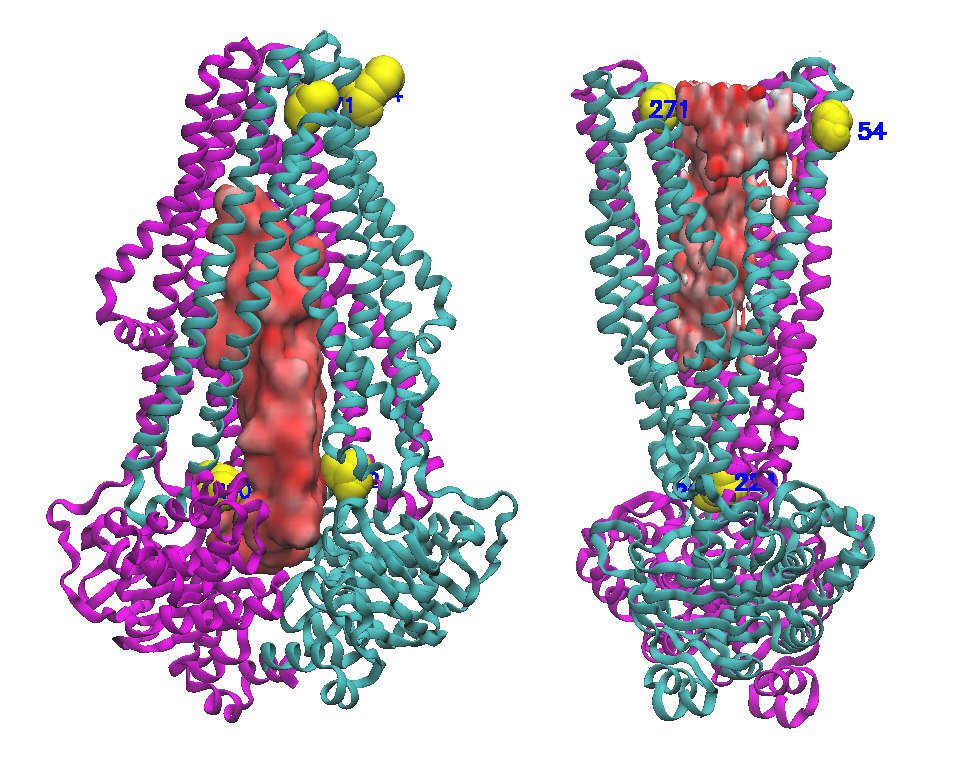
ABC transporters form a super family of membrane-embedded proteins which plays a pivotal role in the cell. They translocate substrates across the cell membrane by alternating between an inward facing and and outward facing conformation using ATP hydrolysis. This conformational switch exposes substrate cavity to either cytoplasm or periplasm, leading to substrate uptake, import or export. It is very helpful to visualize and track the changes in the number of water molecules upon switching. To visualize waters in each state, one can use VMD software. The procedure to produce the following image is detailed in this page. You need a PDB to start (I used 4Q4H from TM287/288 here).
1 Center the structure to the VMD origin
Sometimes the principal axes of the structure do not coincide with VMD origin due to different crystal symmetry. You should do this to assure that solvation box covers the whole backbone. To be able to achieve this, you need to download two packages and put it somewhere you can access in VMD, Orient and la101psx. The full procedure is written here. You need to extract these two packages to a place you remember later. Under GNU/Linux:
tar -xvzf orient.tar.gz
tar -xvzf la101psx.tar.gz
Under windows you can use 7-zip. Once they're extracted, open VMD and load your protein. Then open Tk console from Extensions tab in VMD and run the following command with the directory name you put those two packages in:
lappend auto_path /home/vmd-1.9.3/packages/orient
lappend auto_path /home/vmd-1.9.3/packages/la101psx
now run the following to align the principal axes:
package require Orient
namespace import Orient::orient

set sel [atomselect top "all"]
set I [draw principalaxes $sel]
set A [orient $sel [lindex $I 2] {0 0 1}]
$sel move $A
set I [draw principalaxes $sel]
set A [orient $sel [lindex $I 1] {0 1 0}]
$sel move $A
set I [draw principalaxes $sel]
If you want to remove the axes which are shown, just run:
draw delete all
2 Create PSF model of the protein
Open Extentions>Modeling>Automatic PSF Builder and select output file you want to be created. Click Load input files then Guess and split chains using current selections then Create chains and finally Apply patches and finish PSF/PDB.
3 Create Solvation box
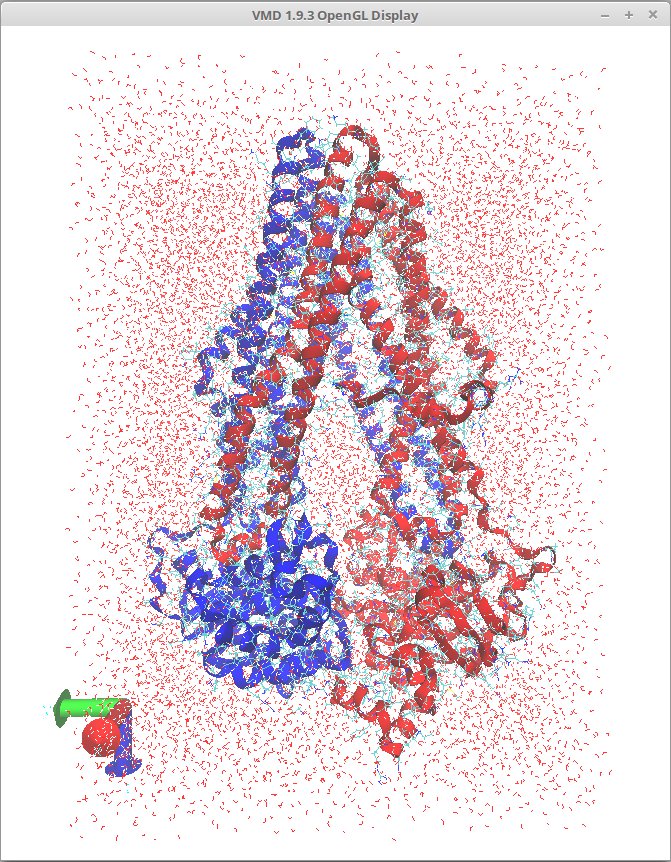
Open Extensions>Modeling>Add Solvation Box. Default values are fine and in the PDB and PSF file fields should be filled with correct values. Then just click Solvate and you'll get this type of output:
4 Limit visualized water molecules to the ones in the cavity
We should only show the water molecules which are in the cavity. For this we need to use Graphics>representations window. Pick solvate in the Selected Molecule on top and enter the following for Selected Atoms:
waters and z<100 and z>-25
Start experimenting with values to limit the waters in the z-axis to the cavity. Do the same for x and y axes. My adjusted values were:
waters and z<65 and z>-5 and x>-70 and x<-45 and y>-6 and y<14
This gave me the final output I looked for. You can change the Drawing Method to QuickSurf to have a nice surface of water inside the cavity.