Magnetic resonance tools, easy to use.
Magnetic resonance tools, easy to use.
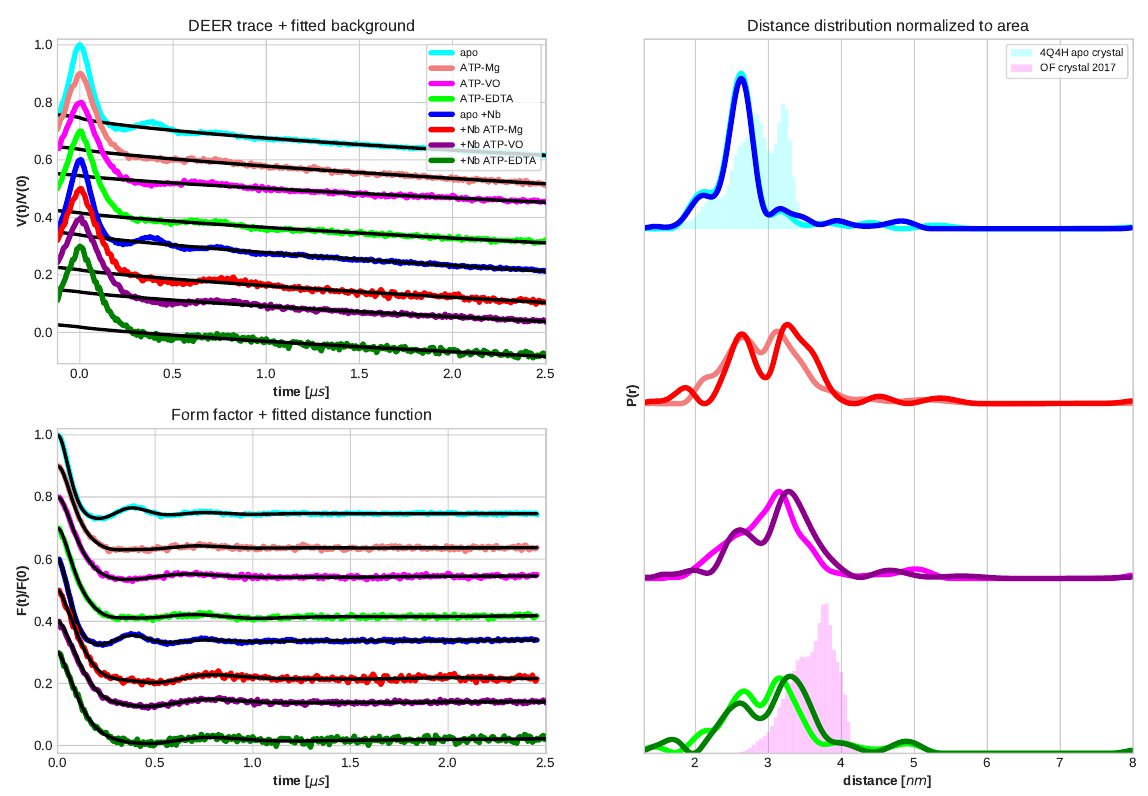
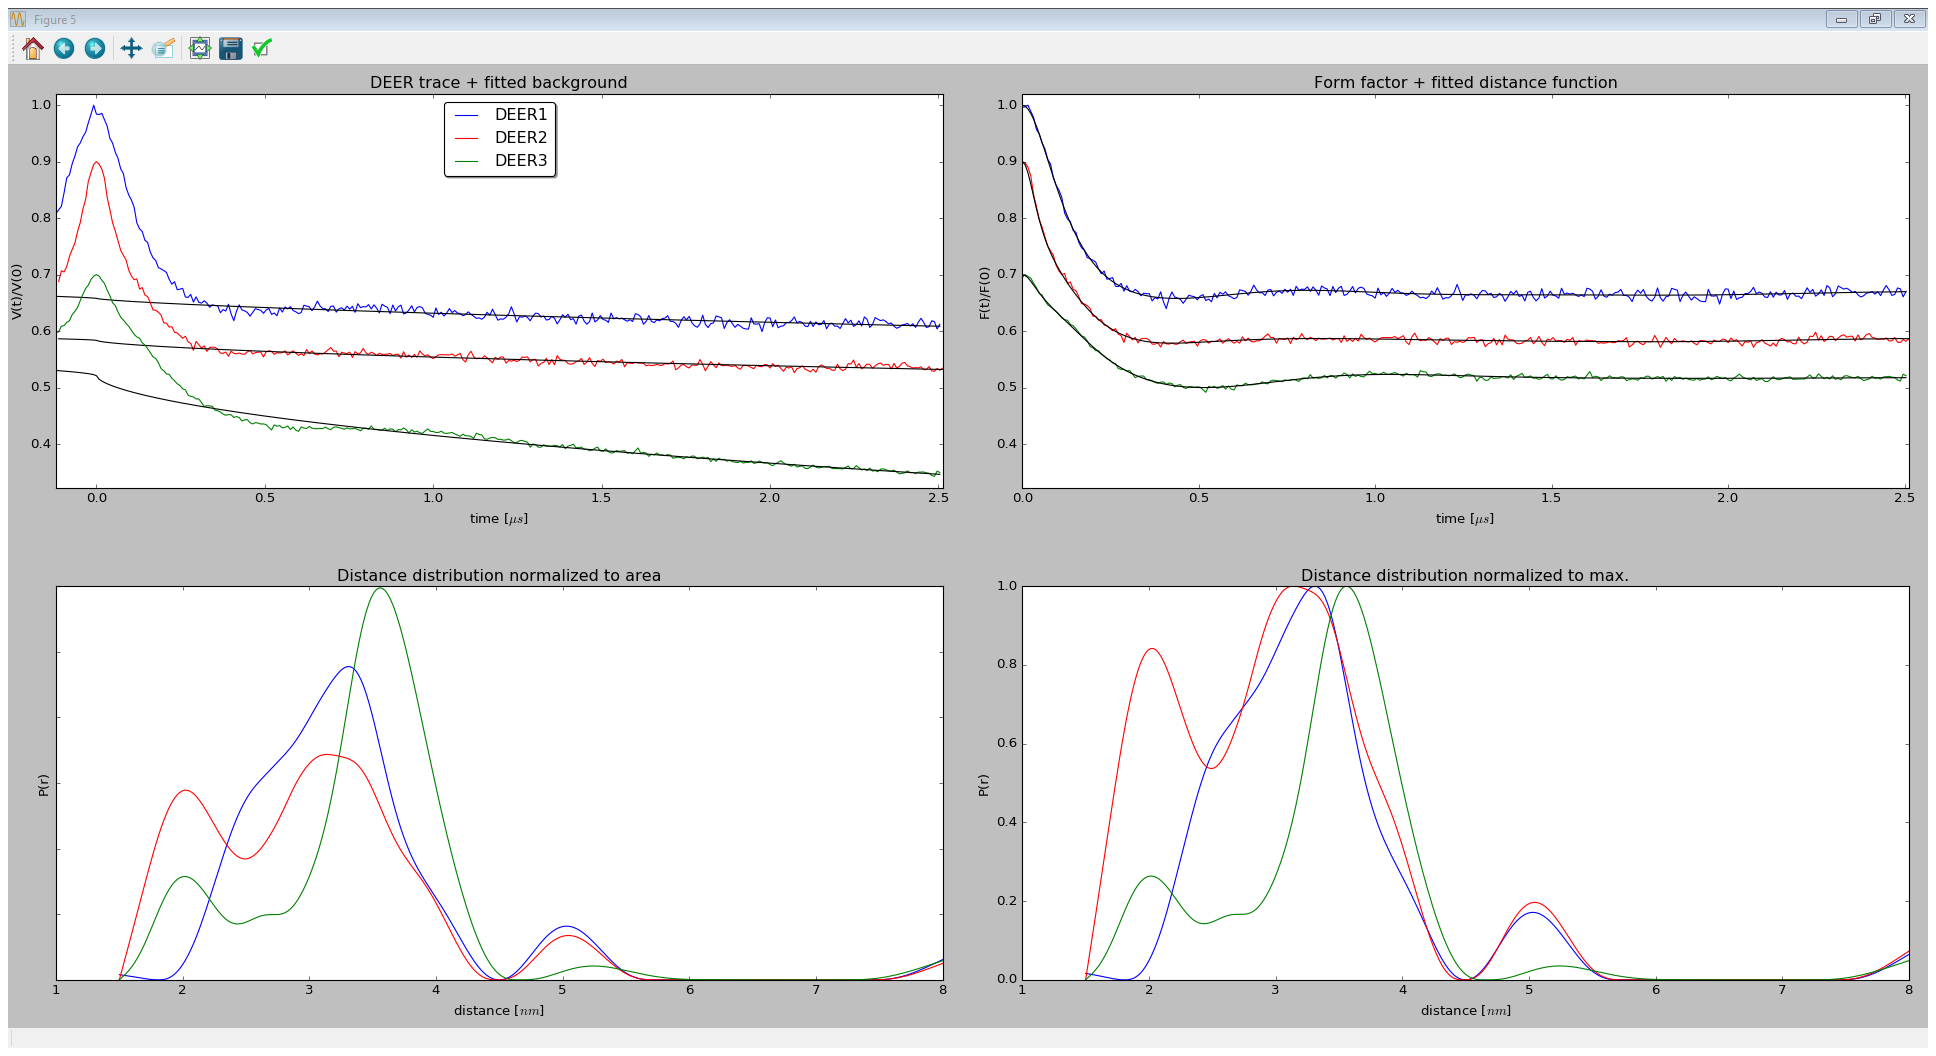
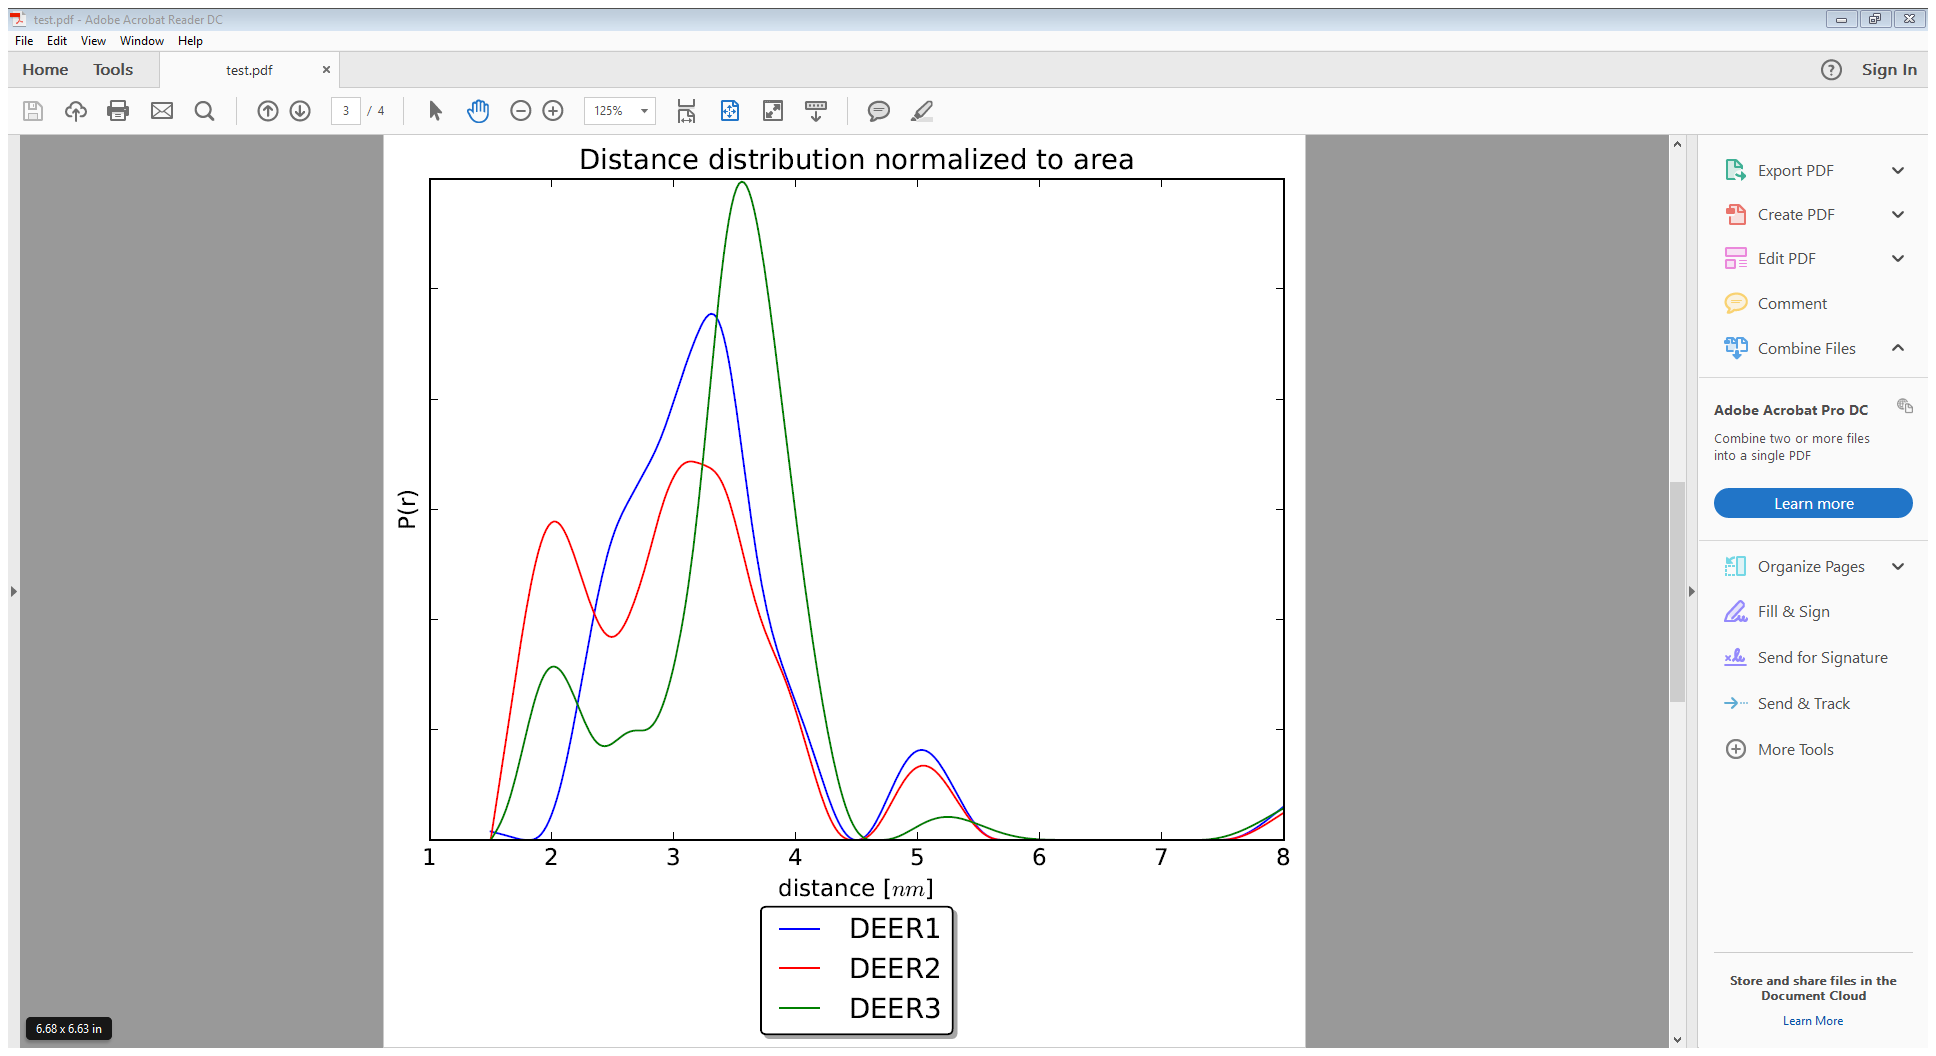
DEER plot is a program that takes output files from DeerAnalysis software package, plots and saves the result as a PDF (or any other image file) for easy use. Simulations from MMM code package can also be used for comparison. DEER plot is also capable of creating a comparison plot out of unlimited number of evaluated DEER data files.
sample output:
This function is accessible within python. You just need to define your file names and directories for DeerAnalysis output files and/or MMM simulation files. Here is an example of the function call:
import sys
sys.path.insert(0, '/mnt/RUBfileShare/Codes/Python/DEERplot/')
from DEERplot_noGUI import *

# Enter the folder name for DeerAnalysis files. You can also leave this empty and add folder to file names
deerFolder = ''
# Enter DeerAnalysis files list here
deerFiles = ['apo_d2_2200ns_DEER_bckg.dat','VO_d2_2200ns_DEER_bckg.dat']
# Enter titles if you want. Otherwise the filenames will become titles.
deerTitles = ['apo','VO']
# And colors if you want
deerColors = ['cyan','magenta']
# Also background colors. Default value is always black unless you have black for main color. Then this will be gray.
backgroundColors = ['black','black']
# Offset for time trace and form factor. I make offset for all data to be seen without overlaps.
offsetArr = [0, .2]
# Set the linewidth for your plots. Default values are 4 for mLineWidth(main line) and 2.5 for oLineWidth (background line).
mLineWidthArr = []
oLineWidthArr = []
# upper panel or lower panel in distance dist. (only used when using plotType='3plotsWoffset')
deerDistOffset = [0, 1]
# Enter the folder name for simulation files. You can also leave this empty and add folder to file names
simFolder = ''
# Simulations file names
simFiles = ['[4Q4H](A){1}271_[4Q4H](A){1}54_distr.dat']
# Titles for simulation
simTitles = ['4Q4H apo crystal']
# Simulations colors
simColors = ['black']
# upper panel or lower panel in distance dist. (only used when using plotType='3plotsWoffset')
simDistOffset = [0]
# x-range for time trace, fit and distance distribution plots. You can also leave this empty
timeTraceXlim = []
fitXlim = []
distanceXlim = [1,8]
# Title to be shown on top of plots.
suptitle = "TM287/288 WT"
# Set the folder for saving plots. By default this will use current folder.
plotFolder = os.path.realpath(__file__)
# Remove some from fit (only fitted function is removed) plot and distance plot (for when you do not have a signal but want to show the primary)
rmFitDistr = []
# Plot file extensions.
plotExts = ['png','pdf','eps','jpg']
# If you want your plot files to have date on them, make this True.
dateInPlot = False
# If you want the function to show you the plot at the end, make this True.
showPlot = True
# Finally, we call the function to plot
plot(
        deerFolder = deerFolder,
        filesArr = deerFiles,
        titlesArr = deerTitles,
        deerColors = deerColors,
        backgroundColors = [], # Color array for backgrounds
        offsetArr = offsetArr,
        mLineWidthArr = [], # LW for all plots
        oLineWidthArr = [], # LW for time trace and form factor offsets
        deerDistOffset = deerDistOffset,
        simFolder = simFolder,
        simFiles = simFiles,
        simTitles = simTitles,
        simColors = simColors,
        plotType='3plotsWoffset', #'4plots','3plots' and '3plotsWoffset'
        simDistOffset = simDistOffset,
        distanceXlim = distanceXlim,
        timeTraceXlim = timeTraceXlim,
        fitXlim = fitXlim,
        suptitle = suptitle,
        plotFolder = plotFolder, # folder for saving the plot files (png, pdf and eps)
        rmFitDistr = rmFitDistr,
        plotExts = plotExts,
        dateInPlot = dateInPlot,
        showPlot = showPlot,
)
The DEERplot_noGUI.py and more help can be found on the github page.
Current verison: 1.1
| Operating system | Download | Comment |
|---|---|---|
| Windows (32/64 bit) |
|
Use the exe file to run. The application may take a while to open due to loading of default packages. If the applications closes unexpectedly the first time, try to reopen it. |
Version 1.0 |
||
|---|---|---|
| Operating system | Download | Comment |
| Windows (32/64 bit) | Use the exe file to run. The application may take a while to open due to loading of default packages. If the applications closes unexpectedly the first time, try to reopen it. | |
| Linux (32/64 bit) |
|
To execute the application in Linux, CD to folder containing the code and run ./DEERplot |
Disclaimer: MMM and DeerAnalysis code packages are the courtesy of epr@ETH Zurich and have nothing to do with DEER plot which uses their output files.
2018.03.09 DEERplot_noGUI added:
2016.12.01 version 1.1:
2016.10.29 version 1.0, initial release: